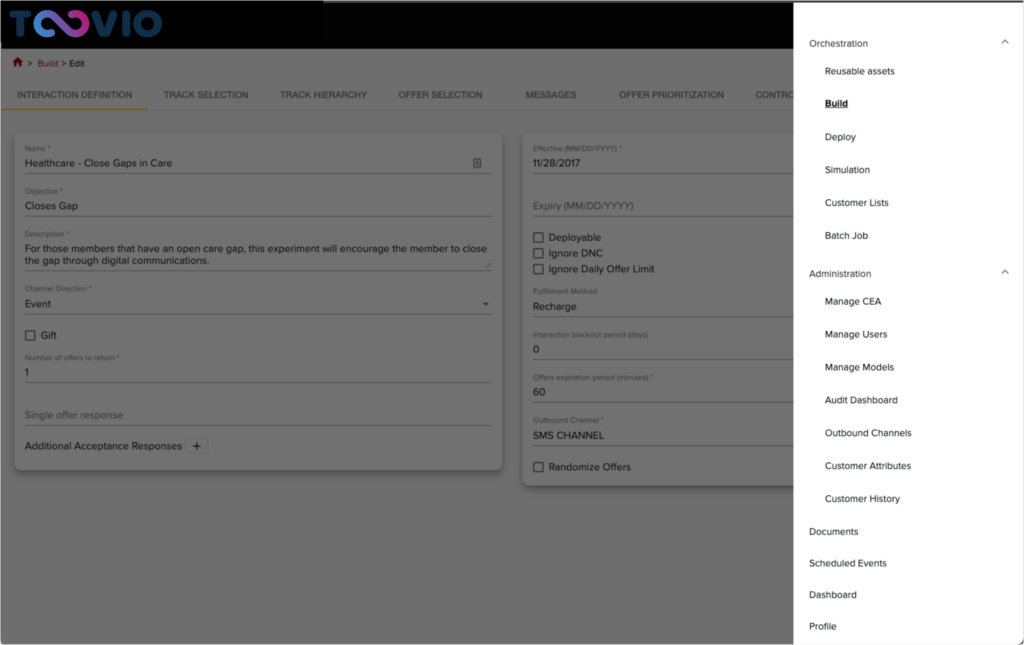
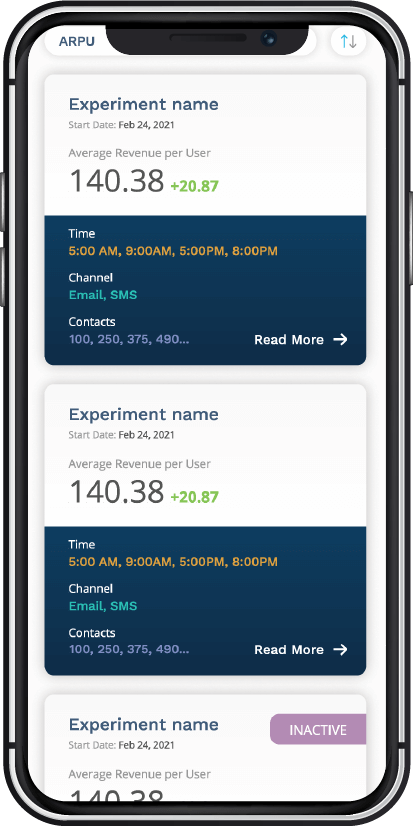
Experiments
Each experiment is associated to a specific measurable outcome. If you have 50 outcomes, you’ll have 50 experiments. We call them experiments, rather than campaigns, specifically because they have control groups and are built upon experimental design principles.
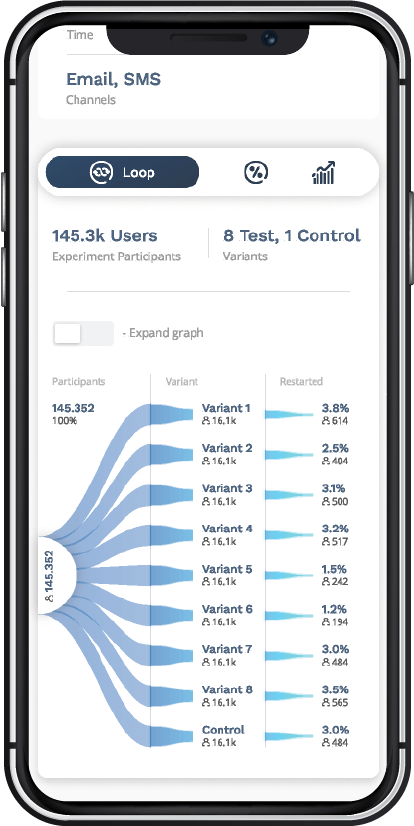
Loop
The loop is a centralized and curated time series data stream which records all of your organizations interactions with customers. Typically, each interaction has the following dispositions; trigger, processed, decision, engagement and most importantly “beyond the click”… conversion. This data stream is arguably the most valuable customer data your organization could wield.
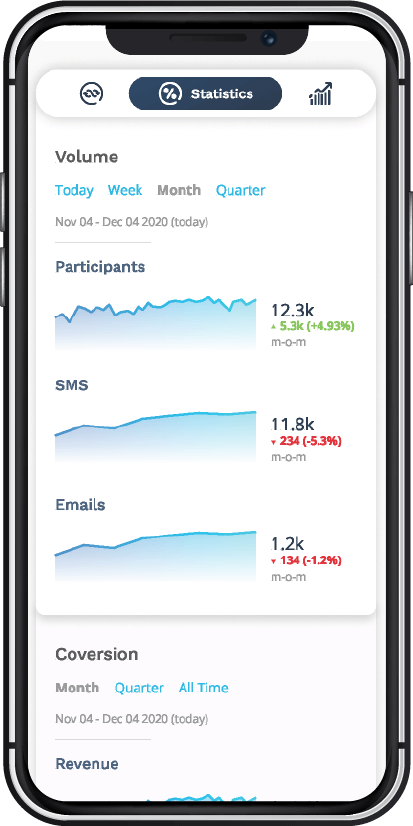
Statistics
Toovio metrics flow from our Volume-Conversion-Value proprietary method of measurement. These stats are fundamentally tied the loop and the nuances of the experiments. This data tells us what’s working and what’s not.
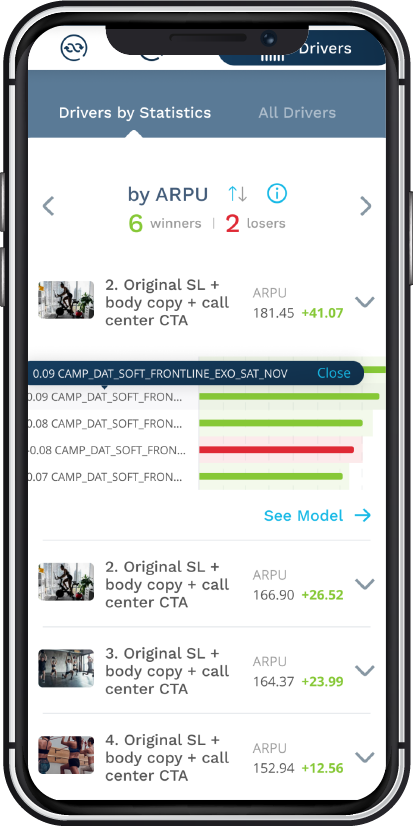
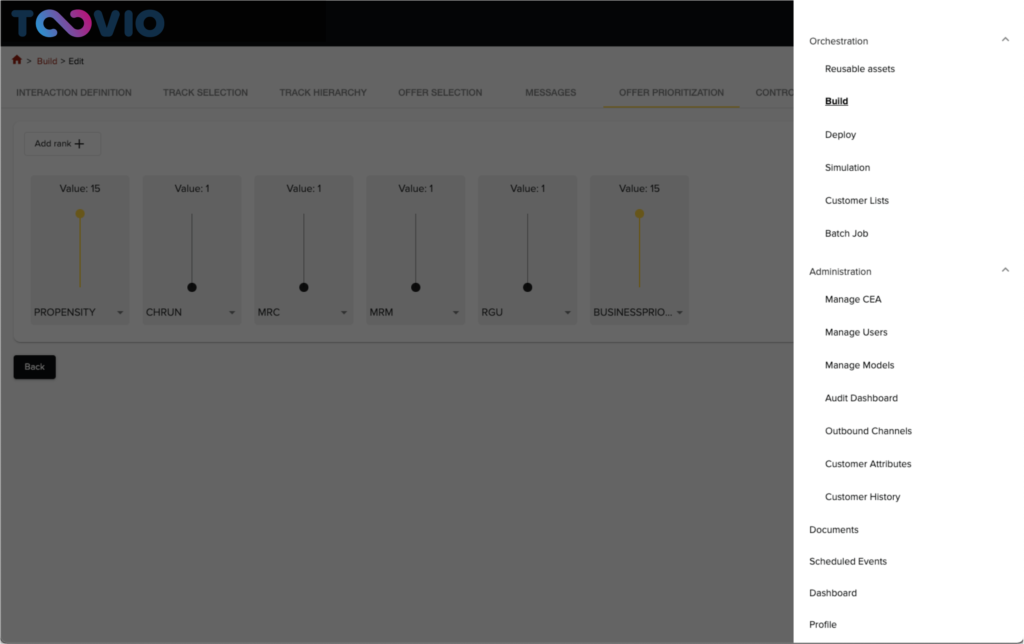
Drivers
The why behind the what. Drivers show us the winners and losers in our experiments determined by the control group. We typically see a 75% or better win rate which means if you tested 10 variants in your experiment 2-3 of those variants are likely to underperform the control group and would be classified as losers. Each variant has a predictive model so we can see the customer data that drives winners vs. losers. This data informs iteration and next steps.

Acquisition
Competition is fierce. Customers behaviour changes in an instant. Use our Next Best Customer solution to identify and acquire new prospects from the market with sophisticated AI profiling.

Cross Sell & Upsell
Right time, right offer. Customer data insights are a bit like produce from a grocery store… they have a shelf life. People, specifically customers and their behavior, change over time. Get value from these data insights before they go stale by recommending relevant offers with our Next Best Sales solution. We use advanced predictive likelihood to purchase models, that challenge the ‘pile em high and price em low’ (one size fits all) sales approach.

Retention
Predict and detect churn with our Next Best Save AI adaptive churn modelling solution. Use for reactive inbound or proactive outbound activities to save customers and build lifetime loyal valuable customers.